

Floor mapping turns your workplace into terrain — the loud machines rise as peaks, the quiet corners settle low and teal — so you can see at a glance where the noise is, and where it needs work.
Flagship add-on · powered by AcoustaPLOT
The 3D landscape
Your loud machines rise as peaks and the quiet corners settle low and teal, so the problem areas read at a glance. Tap a source on the real map and you’d see what we’d do about it.
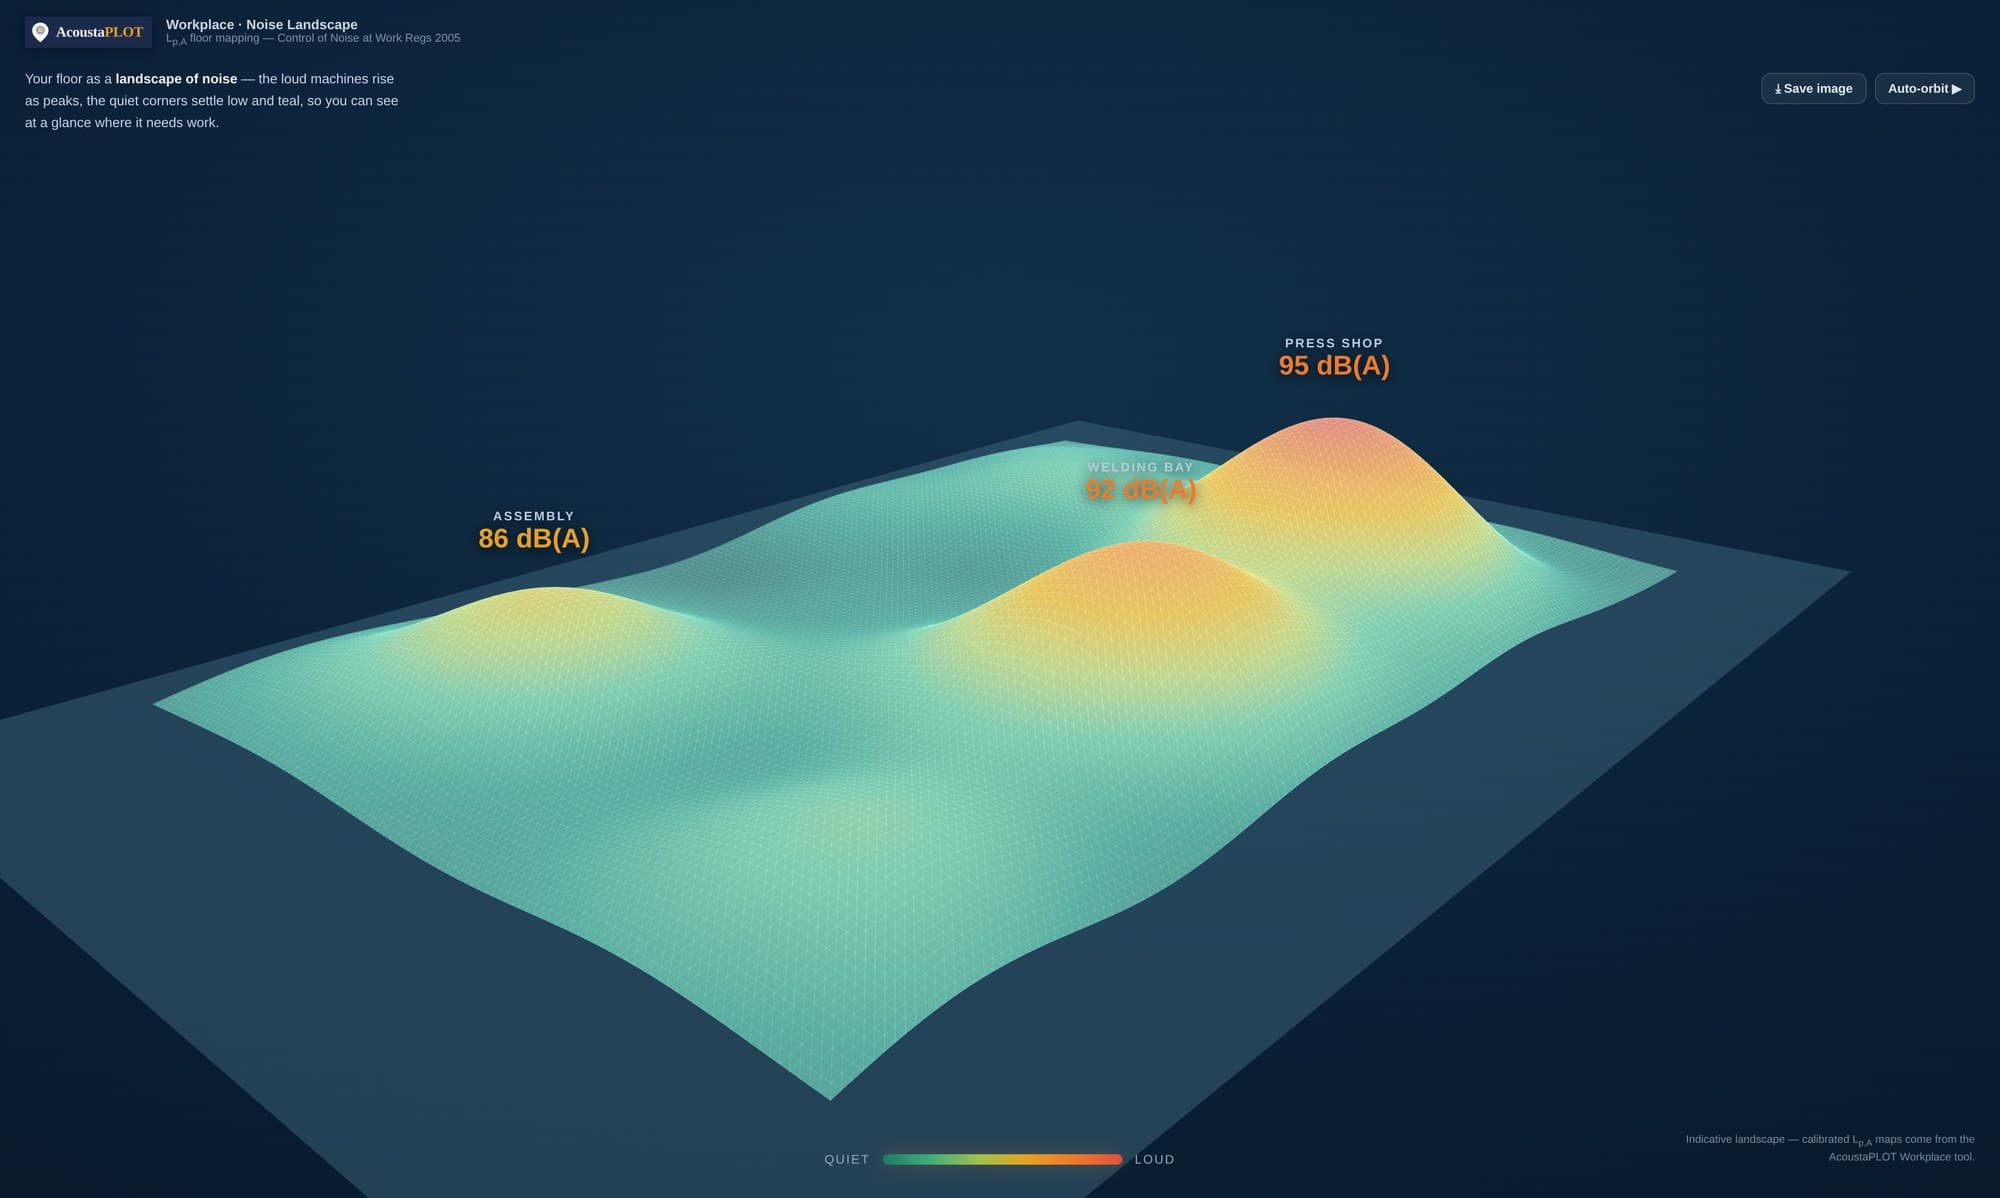
Three hotspots, found before any work started
A number tells you whether you're over the limit. A map tells you where.
The tallest peak on this floor — the first place control spend would go.
Well past the upper action value on its own, before anything else on the floor is added in.
Still over the upper action value — easy to assume is "the quiet end" until it’s actually measured.
The same floor as a 3D room model
Mapped inside the room shell, with reflections contained by the walls and each source labelled in dB(A) — and as a 2D plan, every source ringed with dB contour lines and clipped to the shape of your room, ready to mark up Hearing Protection Zones.
Indicative AcoustaPLOT outputs. Yours is built to scale from the real measurements we take on the day — not a compliance measurement.
How to read the colours
- 80
- lower action value — teal is comfortable, below here.
- 85
- upper action value — a source pushing past here warms to orange.
- 87
- limit value — 87+ glows red, exactly the zones the Control of Noise at Work Regulations want brought under control.
More than a pass or a fail
A number tells you whether you're over the limit. A map tells you where — which machine, which aisle, which corner — so what you spend on control goes exactly where it changes the reading.
The peaks show the sources that dominate the room, not just the average across it.
Enclose or treat the two or three sources that actually move the dose — instead of blanket PPE everywhere.
Re-map after the work and the peaks come down on the picture — evidence the control worked, for auditors and insurers.
Where hearing-protection zones actually need to be, marked from the real shape of the floor.
How we do it
Measured, not estimated
Three steps, all built from real readings taken on your floor.
- 1. We grid your floor. A measurement grid across the working area, taken as the site normally runs — by area and by role.
- 2. We build the surface. Those readings become the continuous noise surface you see above — to scale, with the sources called out.
- 3. You get it to act on. The map, the hotspots ranked, and where control or zones would do the most — delivered as part of your assessment.
Pricing
Priced by the size of your floor
from £750 + VAT
A chargeable add-on to your Noise at Work Care Plan — the price scales with the area we map.
Every tier’s price is a complete package: the area/room count the tier covers, a fixed grid density, and one included revision if something needs correcting after you’ve seen it. Beyond that scope — more rooms, a re-visit, or a change on site — is priced from the change-event menu below, never an open-ended extra.
- years measuring noise at work, carrying out assessments since 2011
- 15+
- assessments across manufacturing, marine, construction and logistics
- 250+
- at one fixed price — no annual re-quote, no surprise uplift
- 4 yrs
About floor mapping
Is floor mapping included in the Care Plan?
It's a chargeable add-on, priced by the area we map, from £750 + VAT. We quote it alongside your fixed four-year price so there are no surprises.
How is it different from a normal assessment?
The assessment gives you the exposure figures and duties. The map gives you the picture — where the noise is across the floor — so control spend lands where it changes the reading.
Do you have to stop production to map?
No. We measure the floor as it normally runs — a quiet version of your site would give a map that's no use to anyone.
Can you re-map after we make changes?
Yes — and it's the best proof the control worked: the peaks come down on the picture. Re-mapping when the floor changes is part of keeping the plan true. A site change (new machinery, a moved line, a reconfigured floor) is a scoped change-event, priced from the menu below — it's never bundled into the base fee, so you always know what you're paying for and why.
What's a billable change-event, and what does it cost?
Anything beyond your tier's included area, grid density and one revision: extra rooms added mid-survey, a re-visit after the floor has changed, or a request outside the original scope. Each is quoted from a fixed, published menu before any work starts — never an open-ended hourly rate and never a surprise on the invoice.
What does the map actually show, and how long is it live?
Every map and export is stamped with the exact metric, measurement date and operating conditions it was taken under, and clearly distinguishes what was directly measured from what's interpolated or predicted between measurement points — we never let a prediction read as a measurement. The interactive version stays hosted and live for 12 months; we offer a remap at your renewal so it never goes stale. You get a downloadable PDF report and a print-ready A3 plan either way — the 12 months is how long the interactive, browsable version stays live, not a limit on what you can keep. There's no separate licence fee: what you're quoted is what you own a copy of, and you keep read access to your records for 12 months after the Care Plan ends.
How do I read the colours on the map?
Every map uses the same fixed legend every time — dB(A) bands with their units always shown, not a scale that shifts from site to site, so one reading always means the same colour. There's also a colour-vision-safe palette option for anyone who needs it, and the legend ships as text as well as colour so it still reads correctly without colour at all.
Do I get one map, or different versions for different people?
One approved survey, three ways to use it: a supervisor view for day-to-day reference, an employee-facing version for inductions, and a management summary for sign-off — all drawn from the same underlying data, so nobody's looking at a different picture.
Can the flythrough video be corrected or refreshed later?
Same policy as the map itself: one included revision if something needs correcting after you've first seen the cut, and a fresh flythrough offered at your renewal alongside a remap, so it's never more than one Care Plan cycle out of date. Anything beyond that one revision is priced from the change-event menu above, same as the map.
Are the flythrough videos captioned?
Yes — every flythrough ships with burned-in or selectable captions and an accessible transcript, the same as every other video on this site.